Key statistics at a glance
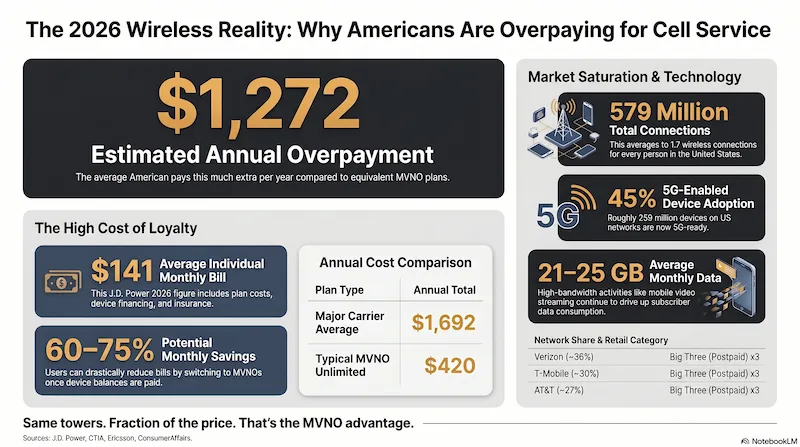
- $141average individual monthly cell phone bill (J.D. Power, 2026)
- $1,272estimated annual overpayment vs. MVNO equivalent plans
- 579Mtotal US wireless connections — 1.7 per person (CTIA, 2024)
- 98%of Americans own a cell phone (ConsumerAffairs, 2024)
- ~21–25 GBaverage monthly mobile data usage per subscriber (Ericsson, 2025 est.)
- ~45%of US wireless connections are on 5G-enabled devices (CTIA, 2024)
Infographic generated via NotebookLM from official carrier sources. Analysis by SwitchNinja Staff.
What Americans pay for cell phone service
The average individual US cell phone bill is $141 per month in 2026, according to J.D. Power's most recent wireless billing study. That figure includes device financing and insurance where applicable — plan-only costs are lower, but most Americans bundle financing into their monthly bill. In 2023, the same J.D. Power methodology produced an average of $156/month, suggesting some modest downward pressure from budget competition.
For families on a 4-line plan, industry estimates place the typical monthly bill between $160 and $200 per month — lower on a per-line basis than individual accounts, but still significantly higher than MVNO alternatives.
$141
Avg. individual monthly bill
J.D. Power, 2026
$160–200
Avg. 4-line family plan/mo
Industry estimates, 2025
The overpayment gap: ~$1,272 per year
MVNOs — prepaid carriers that lease network access from the Big Three — offer unlimited plans starting at $25–45/month on the same underlying Verizon, T-Mobile, and AT&T towers. The primary trade-off: MVNO customers can be deprioritized during peak congestion, and they don't have access to carrier retail stores or device financing. For most users, those trade-offs are minor. The gap in cost translates to an estimated $1,272 more per year for a consumer staying on a major carrier postpaid plan.
| Plan Type | Avg. Monthly | Annual Cost |
|---|---|---|
| Major carrier average (J.D. Power 2026) | $141 | $1,692 |
| Typical MVNO unlimited (e.g., Visible, Tello, Mint) | $35 | $420 |
| Annual savings by switching | $106/mo | $1,272 |
*MVNO price based on typical unlimited plan price at time of publication. Major carrier average from J.D. Power 2026. Actual savings vary by plan and usage.
⚡ Ninja Tip
If you're financing a phone through your carrier, you're not locked in by a contract — you're locked in by the unpaid balance. Once that balance is paid off, you can take your unlocked phone to an MVNO and cut your bill by 60–75%. The first year of MVNO savings often covers that remaining phone balance entirely.
US wireless market size
The US wireless market has 579 million total wireless connections as of 2024, according to CTIA's Annual Wireless Industry Survey — roughly 1.7 connections per person. That figure exceeds the US population because many Americans maintain multiple active connections: smartphones, tablets, smartwatches, and connected devices.
98% of Americans own a cell phone as of 2024 (ConsumerAffairs, citing survey data), making mobile one of the most universally penetrated consumer technologies in the country.
Carrier market share in 2026
Three carriers own virtually all US network infrastructure. The subscriber counts below include both their direct retail customers and MVNO brands that lease their network — every wireless subscriber in the US ultimately routes through one of these three networks.
| Carrier | Approx. Subscribers | Network Share | Network |
|---|---|---|---|
| Verizon | ~146 million | ~36% | Own network |
| T-Mobile | ~140 million | ~34% | Own network |
| AT&T | ~119 million | ~29% | Own network |
Source: Carrier earnings reports and industry analysis, 2025–2026. Network share reflects total subscribers on each network — including MVNO brands that lease access. Example: Mint Mobile subscribers count toward T-Mobile's network share; Visible subscribers count toward Verizon's.
Note: These figures reflect network infrastructure ownership. At the retail level, MVNO brands — Mint Mobile, Visible, Cricket, Metro, US Mobile, Tello, and others — account for an estimated 15–20% of total US wireless subscribers, all of whom use one of the three networks above.
T-Mobile has significantly closed the gap with Verizon over the past five years, largely driven by the 2020 Sprint merger and aggressive 5G mid-band spectrum deployment. All three carriers now compete across nearly every geographic market — the biggest differentiation is rural coverage depth (Verizon) and urban 5G speed (T-Mobile).
Prepaid and MVNO market share
The US remains heavily postpaid-dominant. Approximately 75–80% of US wireless subscribers are on postpaid plans, with the remaining 20–25% on prepaid. This stands in contrast to many global markets where prepaid is the default.
MVNOs — brands like Mint Mobile, Visible, Cricket, Metro by T-Mobile, and US Mobile — represent an estimated 15–20% of total US wireless subscribers, though exact figures vary by methodology. Notably, cable company MVNOs (Xfinity Mobile, Spectrum Mobile) captured approximately 45% of all new wireless customer growth in 2025, according to Recon Analytics — a dramatic shift that signals accelerating mainstream acceptance of MVNO-style pricing.
Why MVNOs are growing
MVNOs offer the same Verizon, T-Mobile, and AT&T network coverage at a fraction of the postpaid price — because they buy network access wholesale and pass the savings on. The trade-offs (no in-store financing, potential deprioritization during peak congestion) matter less to the growing share of consumers who buy phones outright and use Wi-Fi most of the day.
Data usage and 5G adoption
~21–25 GB
Avg. monthly data per subscriber
Ericsson / OpenVault, 2025 est.
~45%
Of connections on 5G-enabled devices
CTIA Annual Survey, 2024
Mobile data consumption continues to rise. The average US subscriber uses approximately 21–25 GB of mobile data per month — up from roughly 18–20 GB in 2024 — driven primarily by mobile video streaming, social media, and video calling. (Ericsson's global Mobility Report cites ~21.6 GB globally as of Q3 2024; US figures tend to run slightly higher.) The growth of 5G has also removed the speed ceiling that previously dampened mobile data use.
On 5G adoption: CTIA's 2024 survey counted approximately 259 million 5G-enabled devices on US networks — representing nearly half of all wireless connections. Note that "5G-enabled device" means the device supports 5G; actual 5G coverage experienced by users varies significantly by carrier, location, and whether the device is on sub-6GHz or mmWave 5G.
Carrier switching behavior
Exact annual carrier switching rates are not published by a single authoritative source, but industry estimates consistently suggest approximately 1 in 5 Americans (around 20%) seriously considered switching carriers in 2025. The number who actually completed a switch is lower, but eSIM portability and zero-commitment MVNO plans have dramatically reduced the friction of following through.
The trend most worth watching: cable company MVNOs (Xfinity Mobile, Spectrum Mobile, Cox Mobile) captured nearly half of new wireless customer growth in 2025, according to Recon Analytics — suggesting that the next large wave of carrier switching will be from traditional Big Three carriers to bundled cable+wireless packages, rather than to standalone MVNOs.
Full statistics summary
| Metric | Figure | Source | Year |
|---|---|---|---|
| Avg. individual monthly bill | $141/month | J.D. Power | 2026 |
| Avg. 4-line family plan | $160–$200/month | Industry estimates | 2025 |
| Annual overpayment vs. MVNO | ~$1,272/year | SwitchNinja calculation | 2026 |
| Total US wireless connections | 579 million | CTIA | 2024 |
| Connections per person | 1.7 | CTIA | 2024 |
| Americans who own a cell phone | 98% | ConsumerAffairs | 2024 |
| Verizon market share | ~36% | Industry analysis | 2025 |
| T-Mobile market share | ~34% | Industry analysis | 2025 |
| AT&T market share | ~29% | Industry analysis | 2025 |
| Prepaid share of subscribers | ~20–25% | Industry estimates | 2025 |
| MVNO subscriber share | ~15–20% | Industry estimates | 2025 |
| Avg. monthly data usage | ~21–25 GB (US est.) | Ericsson / OpenVault | 2025 |
| 5G-enabled connections | ~45% (~259M devices) | CTIA | 2024 |
| Considered switching carriers | ~1 in 5 Americans | Industry estimates | 2025 |
Statistics are compiled from the sources listed. Where exact published figures were unavailable, ranges reflect consensus across multiple industry analyses. SwitchNinja will update this page quarterly as new data is published.
Methodology note
Statistics on this page are sourced from publicly available reports by J.D. Power, CTIA, Ericsson, ConsumerAffairs, Recon Analytics, and industry analysis published in 2024–2026. The annual overpayment estimate uses the J.D. Power 2026 average monthly bill ($141) minus the typical MVNO unlimited plan price at time of publication (~$35/month), multiplied by 12 months. Carrier market share figures represent approximate subscriber counts based on carrier earnings reports and industry analysis — exact figures vary by reporting period and methodology. SwitchNinja does not have access to non-public carrier data.
Frequently asked questions
What is the average cell phone bill in the US in 2026?▼
$141 per month, according to J.D. Power's 2026 wireless billing study. This includes device financing and insurance where applicable. Plan-only costs are lower, but most Americans bundle device payments into their monthly bill.
How much do Americans overpay for cell phone plans?▼
Approximately $1,272 per year per line, based on the gap between the J.D. Power average ($141/month) and a typical MVNO unlimited plan (~$35/month). The key insight: MVNOs use the same Verizon, T-Mobile, and AT&T towers — the network is identical, the price is not.
What percentage of Americans are on prepaid cell phone plans?▼
Approximately 20–25%. The US is one of the most postpaid-heavy wireless markets in the world — the opposite of most global markets where prepaid dominates. That's beginning to shift as cable MVNOs and budget prepaid brands grow rapidly.
Which carrier has the most subscribers in the US?▼
Verizon leads with approximately 146 million subscribers (~36% market share), followed by T-Mobile at ~140 million (~34%) and AT&T at ~119 million (~29%). T-Mobile has narrowed the gap with Verizon significantly since the Sprint merger in 2020.
What is the average monthly data usage per cell phone user?▼
Approximately 21–25 GB per month as of 2025, up from ~18–20 GB in 2024. Mobile video streaming is the primary driver. Ericsson's global figure was ~21.6 GB in Q3 2024; US subscribers tend to use slightly more.
Why is the average cell phone bill going down?▼
The average individual wireless bill dropped from $156/month in 2023 to $141 in 2026 — a ~10% decrease — despite inflation rising in nearly every other consumer category. The drivers: intensifying competition from MVNOs and cable carriers (Xfinity, Spectrum) capturing new subscribers, carrier promotions to retain customers, and a growing share of consumers paying off device financing and finding cheaper options. Unlike most subscription services, wireless is one of the few categories where prices are trending down.
Find out if you're overpaying
See which plan actually fits your usage
Answer 8 quick questions. Get a personalized recommendation — free, no email required.
Find My Perfect Plan →See how the big three stack up: our Verizon vs T-Mobile comparison or the T-Mobile vs AT&T comparison.